
The Toronto Regional Real Estate Board (TRREB) has released its June housing data. Market conditions continued to tighten, with sales posting a fourth consecutive month of year-over-year gains and new listings declining for the fifth month in a row. Selling prices remained lower than a year ago, though the annual rate of decline has receded in recent months as growing demand meets a shrinking supply of listings.
A total of 6,770 home sales were reported through the MLS, up 9.4% compared to June 2025. New listings fell 12.9% year-over-year to 17,282. Active listings declined to 27,329, down 13.5% from last year. Months of inventory for the region tightened to roughly 4.0, down from 4.1 in May and 4.2 in April, continuing the steady drawdown of supply. For the first half of 2026, sales came in slightly ahead of the same period last year while new listings were down substantially.
The average GTA home sold for $1,058,658, representing a 3.9% year-over-year decline, tighter than the 4.6% recorded in May. The MLS Home Price Index (HPI) Composite Benchmark was down 5.4% across the GTA (-4.3% in Toronto), an improvement from the 6.7% decline in May and offering further evidence that the downward pressure on pricing is tapering off. On a seasonally adjusted basis, both the average selling price and the HPI Composite edged up month-over-month. Listings sold in an average of 29 days on market, up 11.5% from a year ago, with final sale prices coming in at 98% of the asking price.
Preparing to sell your house? Explore these related readings for more insights.
- Should You Renovate Before You Sell?
- How to Sell Your Home Without Losing Money
- Should You Sell Your Home Before Buying a New One?
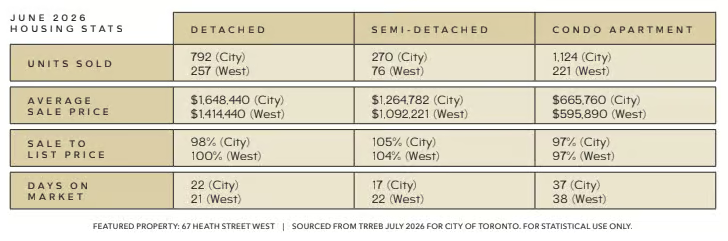
Sales by Property Type
- Detached: $1,364,204 (↓ 2.0% year over year / ↑ 0.4% month over month)
- Semi-detached: $1,038,973 (↓ 4.6% YoY / ↓ 2.7% MoM)
- Townhomes: $844,579 (↓ 3.1% YoY / ↑ 0.5% MoM)
- Condominiums: $630,688 (↓ 9.5% YoY / ↓ 1.4% MoM)
Detached homes accounted for the largest share of June sales (48.1%), followed by condominiums (25.3%), townhomes (15.9%), and semi-detached properties (9.1%). All four property types posted gains in sales volume year-over-year, led by a 14.3% increase in condominium transactions, a segment where improved affordability continues to draw buyers back into the market.
June marks the fourth consecutive month of year-over-year sales gains, and the fifth straight month of meaningful declines in new listings. With borrowing costs lower than last year, and the Bank of Canada overnight rate holding at 2.25%, the conditions remain in place for sustained activity. However, buyers continue to weigh broader economic uncertainty in their decisions. If market conditions continue to tighten through the second half of the year, selling prices could move back in line with 2025 levels and eventually post increases.
If you are planning to buy or sell this summer, recognizing how these conditions play out at the neighbourhood level is essential. As the market continues to evolve, a thoughtful strategy and clear understanding of the relevant housing data will help to ensure a successful outcome. A Christensen Real Estate Group sales representative can help you navigate these conditions with clarity, experience, and a strategy tailored to your goals.
Exploring the West Toronto real estate market? We can guide you toward an exceptional result. Call 416-722-4723 or reach us by email at evan@christensengroup.ca.