
The Toronto Regional Real Estate Board (TRREB) has released its January housing data. While it remains early in the year, buyer-favourable conditions persist. With higher inventory and improved affordability, motivated sellers are working through a period of pricing adjustment.
A total of 3,082 home sales were reported through the MLS system in January, down 19.3% compared to January 2025. New listings also declined, falling 13.3% year over year to 10,774. While both sales and listings were lower, active listings remained high at 17,975, keeping overall supply elevated and sustaining buyer leverage across most market segments. Months of inventory for the region now sits at 5.83.
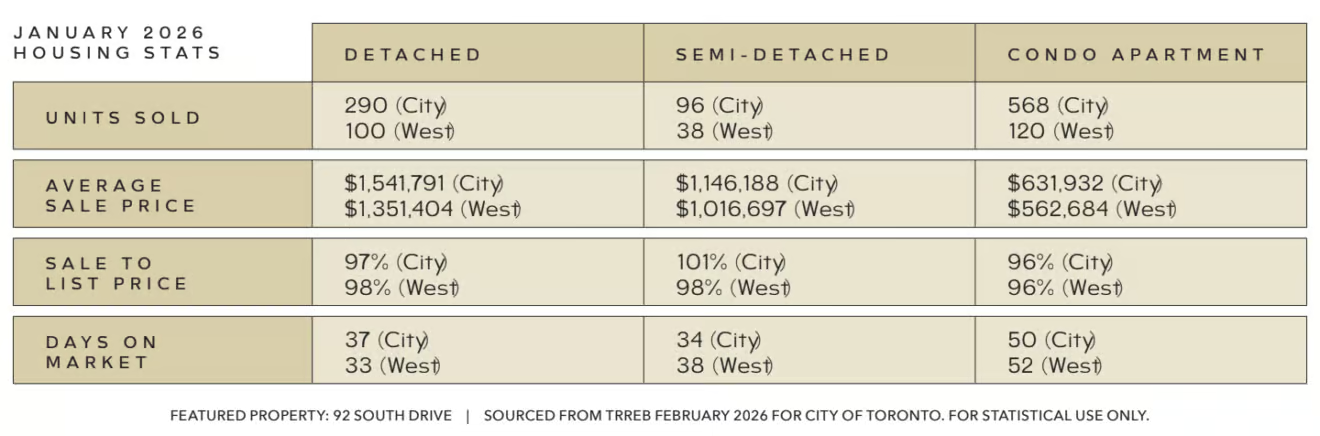
The average GTA home price came in at $973,289, representing a 6.5% year-over-year decline. The MLS Home Price Index (HPI) Composite Benchmark was down approximately 8% compared to January 2025 (-6.6% in Toronto), reinforcing that pricing has adjusted broadly, rather than through changes in sales mix alone. Homes are taking longer to sell, with days on market sitting at 50, a 21.6% increase, reflecting a more deliberate pace. The average sale-to-list price was 97% for January.
Seeking more insights about buying real estate in Toronto? Consider these related readings.
- How to Buy a Privately Listed Home
- How to Buy Another House While Owning a House
- How to Make an Offer on a House
Most sales activity in January occurred in the mid-market price ranges, with 81% of transactions concentrated below $1.25 million. Sales over $2 million accounted for only 4.4% of all transactions. In this segment, activity remains more selective, particularly where pricing expectations have yet to fully align with current market conditions.
Sales by Property Type
Detached: $1,277,915 (↓ 7.4% year over year / ↓ 2.0% month over month)
Semi-detached: $945,967 (↓ 9.7% YoY / ↓ 1.2% MoM)
Townhomes: $819,543 (↓ 9.4% YoY / ↓ 5.0% MoM)
Condominiums: $604,759 (↓ 9.8% YoY / ↓ 3.7% MoM)
Detached homes continued to account for the largest share of January sales (43.9%), followed by condominiums (27.8%), townhomes (18%), and semi-detached properties (9%). The consistency of year-over-year price declines across all housing types highlights a market-wide recalibration rather than softness isolated to a single segment.
Overall, January’s data points to a market in transition. Inventory remains a defining feature, pricing is still adjusting, and buyers are exercising patience. At the same time, transactions are occurring, negotiations are active, and well-positioned homes are selling. Sellers who align pricing with current conditions are seeing results, while buyers benefit from choice and leverage.
If a move is on your horizon, understanding how these conditions play out at the neighbourhood and property-type level is essential. Market dynamics are evolving, and thoughtful strategy and clear data continue to make a meaningful difference. We can help you navigate the current environment with clarity, experience, and confidence.
For over 40 years, our clients have trusted us to minimize risk, offer unbiased opinions, and ensure their best interests are served. Contact us today to talk about your needs. Email us at evan@christensengroup.ca or call 416-722-4723.